chou109/dsh-strength-meter ↗★ 0
dsh-strength-meter
⚡ DshStrengthMeter — a reasoning-strength quick controller (simple slider + advanced model/effort/speed panel) and per-model token usage stats for the DeepSeek Harness Web UI
安装
此插件尚未提供可验证的 bundle,或兼容性检查未通过。请先阅读仓库说明。 阅读完整 README ↗
说明文档
阅读完整 README ↗⚡ dsh-strength-meter — Model Usage Stats for DSH Web
dsh-strength-meter: a model token-usage statistics plugin for the DeepSeek Harness Web UI — a full "Usage stats" page in Settings (metric cards, per-model donut, activity heatmap, daily trend). All data comes from your local session logs; nothing is uploaded.
| Language | Link |
|---|---|
| English | This document |
| 中文 | README.zh.md |
Table of Contents
If you are a human, read this
What this plugin does
The plugin adds a full "Usage stats" page under Settings → Usage stats, presented in the following blocks:
Block 1 — six metric cards (overview at the top)
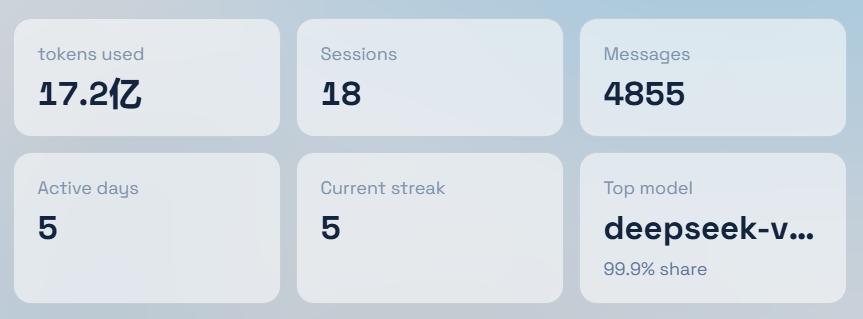
- Tokens used: total token consumption in the selected range;
- Sessions: sessions active in the range;
- Messages: total messages in the range;
- Active days: days with any activity in the range;
- Current streak: consecutive active days up to today (GitHub-style);
- Top model: the model that consumed the most tokens in the range, with its share (%).
The header offers a time-range switch (Last 7 days / Last 30 days) and a Refresh button (forces a fresh recomputation, bypassing the cache).
Block 2 — Model usage (per-model totals)
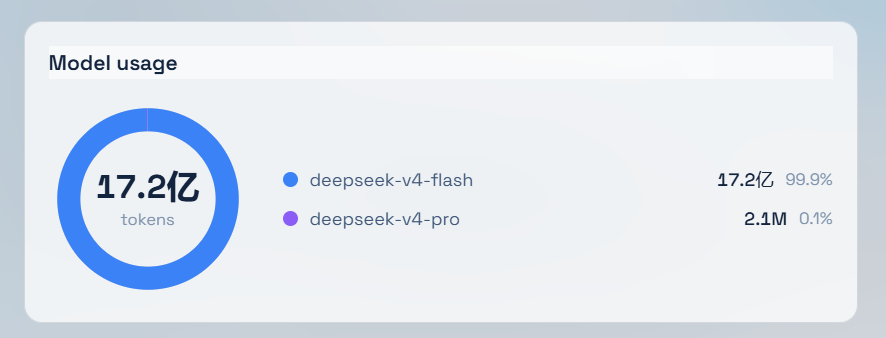
- A donut of the total token consumption in the range;
- A legend on the right: model name, tokens and share (%). Same-named models across providers are merged into one row.
Block 3 — Activity heatmap
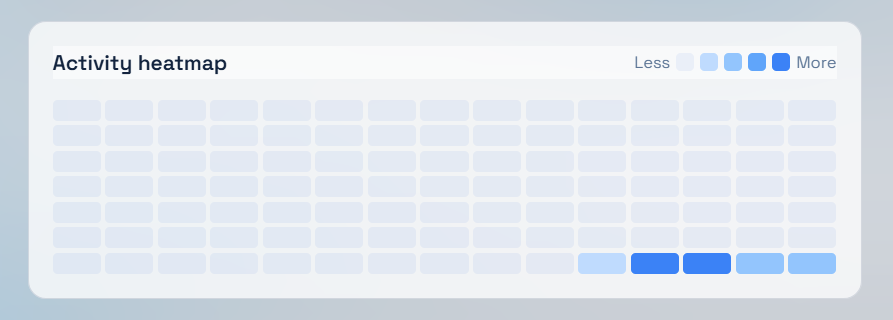
- A 15-week × 7-day matrix in GitHub-contribution style;
- Cell shade scales against the highest-token day in history: ≥75% darkest, ≥50% next, ≥25% mid, >0 light blue, no activity blank (legend "Less → More").
Block 4 — Daily token trend
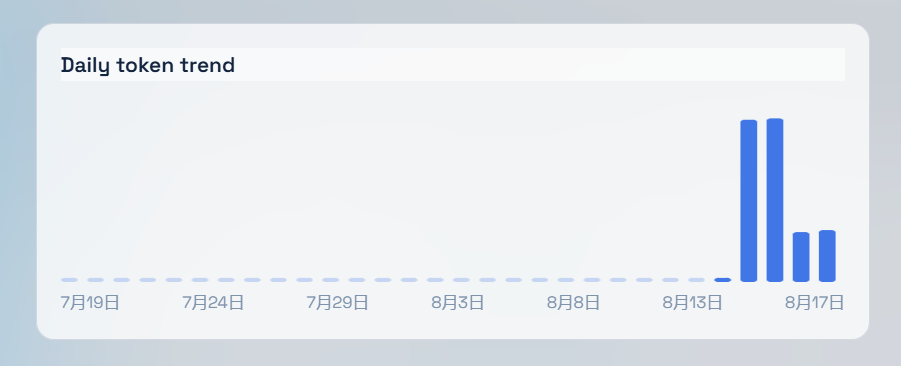
- A bar chart of tokens per day within the selected range (hover for the exact value), with auto-labeled date ticks.
Statistics are computed from your local persisted session logs (~/.dsh/sessions) — nothing is uploaded.
Manual install
Prerequisites (all must hold):
- A working DSH Web (
dsh web) reachable athttp://127.0.0.1:3080; - You can locate the DSH data dir:
%USERPROFILE%\.dshon Windows,~/.dshelsewhere (written as~/.dshbelow); - Network access to this repository (or a local copy).
Option A — one-command install (recommended, no npm, no build)
In mainland China, use the Gitee mirror instead:
https://gitee.com/chill109/dsh-strength-meter(swap the repo URL in the commands below).
Windows (PowerShell):
powershell -ExecutionPolicy Bypass -Command "Invoke-WebRequest 'https://github.com/chou109/dsh-strength-meter/raw/main/install.ps1' -OutFile install.ps1; .\install.ps1"
macOS / Linux / WSL (bash):
bash <(curl -fsSL https://raw.githubusercontent.com/chou109/dsh-strength-meter/main/install.sh)
The installer does three things (idempotent — safe to re-run):
- puts the source into
~/.dsh/plugins/dsh-strength-meter(zip download or git clone); - creates a junction (Windows) / symlink (macOS·Linux) in
~/.dsh/profiles/node_modules; - registers the
dsh-strength-meterentry in~/.dsh/profiles/web/cordis.patch.yml.
Option B — manual, three steps (offline environments / to understand the wiring)
- Get the source:
git clone https://github.com/chou109/dsh-strength-meter.git(or download the zip) anywhere, e.g.~/.dsh/plugins/dsh-strength-meter; - Link it (the loader resolves plugins from
~/.dsh/profiles):# Windows (junction, no admin rights) New-Item -ItemType Junction -Path "$env:USERPROFILE\.dsh\profiles\node_modules\dsh-strength-meter" -Target "$env:USERPROFILE\.dsh\plugins\dsh-strength-meter"# macOS / Linux (symlink) ln -s ~/.dsh/plugins/dsh-strength-meter ~/.dsh/profiles/node_modules/dsh-strength-meter - Register: append to
~/.dsh/profiles/web/cordis.patch.yml:- insert: - id: dsh-strength-meter name: 'dsh-strength-meter'
Last step: restart the dsh web process — a page refresh is not enough for a newly added plugin (the plugin set is snapshotted at boot; an already-open tab keeps its old boot manifest):