NeverToEver/dsh-usage-cost-dashboard ↗★ 1
@dsh-community/dsh-usage-cost-dashboard
A community plugin providing LLM usage, cost analytics, budget alerts and an observability panel for DeepSeek Harness.
AI Analysis
核心用途是追踪 LLM 的 token 消耗并估算费用,在 Web UI 渲染紧凑的用量指示器。适合需要监控 API 成本、设置预算告警的 DSH 用户。
Install
npx -p @deepseek-ai/dsh dsh plugin --profile web add github:NeverToEver/dsh-usage-cost-dashboardREADME
Read the full README ↗dsh-usage-cost-dashboard
A community plugin for DeepSeek Harness that tracks LLM token usage, estimates costs, and adds a lightweight Web UI indicator beside the composer.

Overview
DeepSeek Harness already provides low-level telemetry and token-meter primitives, but it does not ship a ready-to-use cost/usage panel for everyday users.
This plugin fills that gap by:
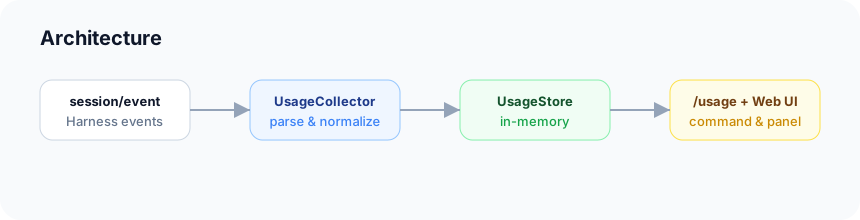
- collecting token usage from
session/event - exposing a
/usagecommand with filtering and reporting options - rendering a compact, theme-aware usage indicator in the Web UI
Status: early development. The current version uses in-memory storage and estimated pricing.
Demo
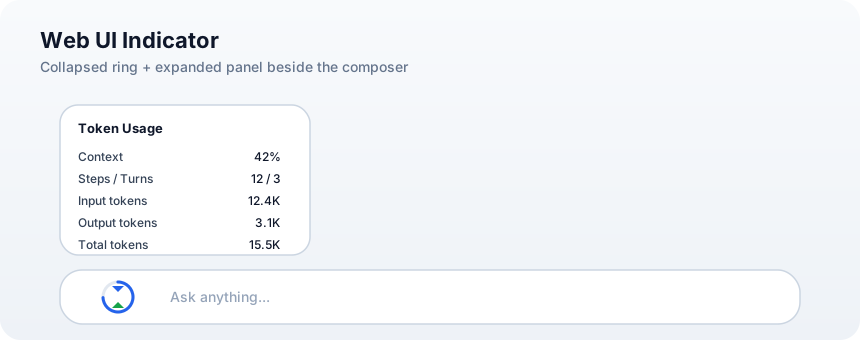
Web UI indicator
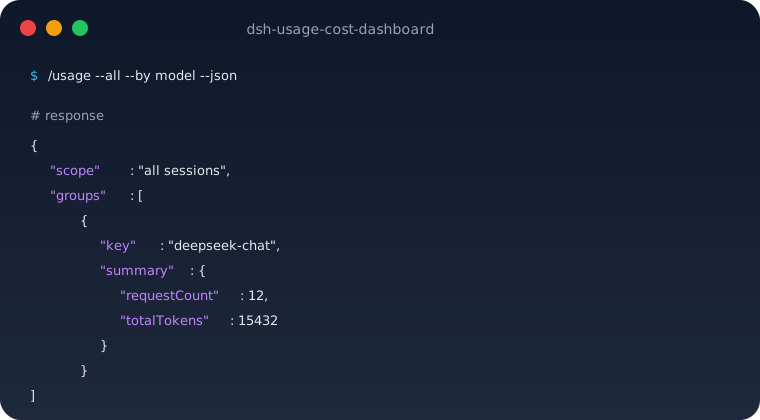
Usage command
Architecture
Features
- Collects provider/model, token counts, timing, and per-step usage from real Harness events
/usagecommand with:- current session or
--allsessions --session,--model,--from,--to,--limit- grouping by
--by modelor--by session --jsonand--csvoutput--exportto write JSON/CSV files
- current session or
- JSONL persistence when configured with
storageFile - Web UI indicator:
- outer ring shows context-window usage
- inner hourglass with two triangles represents input/output tokens
- hover shows total tokens
- click to expand a detailed panel
- follows the Harness light/dark theme
- Smooth expand/collapse animation with reduced-motion support
Requirements
- DeepSeek Harness with the
dshCLI - Node.js 22+ for local development
- pnpm only required for the recommended
dsh plugininstallation path
Installation
Option A: install as a Harness bundle
From a directory that contains this plugin checkout:
dsh plugin --profile web add /path/to/dsh-usage-cost-dashboard
The dsh CLI will add the plugin to the profile's bundle layers.
Option B: manual link
If you prefer not to use pnpm:
cd /path/to/dsh-usage-cost-dashboard
npm install
npm run build
Link the package into your Harness profile:
mkdir -p ~/.dsh/profiles/node_modules/@dsh-community
ln -sfn /path/to/dsh-usage-cost-dashboard ~/.dsh/profiles/node_modules/@dsh-community/dsh-usage-cost-dashboard
Add the plugin to ~/.dsh/profiles/web/cordis.patch.yml:
- insert:
    - id: usage-cost-dashboard
      name: '@dsh-community/dsh-usage-cost-dashboard'
Restart dsh web.
Deploy from this repository
1. Clone
git clone https://github.com/NeverToEver/dsh-usage-cost-dashboard.git
cd dsh-usage-cost-dashboard
2. Install and build
npm install
npm run build
3. Deploy to DeepSeek Harness
Recommended: via dsh plugin
If pnpm and dsh are available:
npm run deploy:web
This runs:
npm run build
dsh plugin --profile web add .
Alternative: manual link (no pnpm required)
npm run deploy:link
This builds the plugin, links this checkout into ~/.dsh/profiles/node_modules/@dsh-community/, and adds the required row to ~/.dsh/profiles/web/cordis.patch.yml.
You can also specify another profile:
bash scripts/deploy-link.sh headless
4. Restart
dsh web
After restart, the /usage command and the Web UI ring indicator will be available.
Configuration
Persistence
By default all usage records are kept in memory. To persist them as JSONL, set storageFile in the plugin config:
- id: usage-cost-dashboard
  name: '@dsh-community/dsh-usage-cost-dashboard'
  config:
    storageFile: '~/.dsh/usage-cost.jsonl'
After enabling persistence, records are appended on every new request and loaded again when the plugin starts.
Usage
Slash command
After installation, open the Harness Web UI and type:
/usage
Available options:
/usage
/usage --all
/usage --session
/usage --model deepseek-chat
/usage --from 1700000000000
/usage --to "2026-01-01"
/usage --limit 20
/usage --by model
/usage --by session
/usage --json
/usage --csv
/usage --export ./usage.json
/usage --export ./usage.csv
/usage --help
Web UI indicator
After restarting dsh web, a circular indicator appears on the left side of the composer:
- The outer ring represents context-window usage and becomes deep blue as it fills.
- The two triangles inside represent input and output tokens.
- Hovering over the indicator shows total tokens.
- Clicking it expands a detailed panel with context, steps/turns, input tokens, output tokens, and total tokens.
Development
npm install
npm run typecheck
npm run build
npm test
Run the minimal demo without a running Harness:
npm run demo
Run the real Harness integration demo:
npm run demo:harness
Project layout
src/
├── index.ts                # Cordis plugin entry
├── types.ts                # shared types
├── client/                 # browser-side Web UI indicator
├── collector/              # session/event -> UsageRecord
├── storage/                # in-memory UsageStore
├── pricing/                # price table and cost estimation
└── command/                # /usage command
Roadmap
- v0.1 core: collection +
/usagecommand - v0.2 persistence (JSONL) and file export
- Web UI indicator (experimental)
- v0.3 budgets and alerts
- v0.4 full Web UI dashboard
Contributing
See CONTRIBUTING.md.
Changelog
See CHANGELOG.md.
License
Usage command
Configuration
Persistence
By default all usage records are kept in memory. To persist them as JSONL, set storageFile in the plugin config:
- id: usage-cost-dashboard
  name: '@dsh-community/dsh-usage-cost-dashboard'
  config:
    storageFile: '~/.dsh/usage-cost.jsonl'
After enabling persistence, records are appended on every new request and loaded again when the plugin starts.
Usage
Slash command
After installation, open the Harness Web UI and type:
/usage
Available options:
/usage
/usage --all
/usage --session
/usage --model deepseek-chat
/usage --from 1700000000000
/usage --to "2026-01-01"
/usage --limit 20
/usage --by model
/usage --by session
/usage --json
/usage --csv
/usage --export ./usage.json
/usage --export ./usage.csv
/usage --help
Web UI indicator
After restarting dsh web, a circular indicator appears on the left side of the composer:
- The outer ring represents context-window usage and becomes deep blue as it fills.
- The two triangles inside represent input and output tokens.
- Hovering over the indicator shows total tokens.
- Clicking it expands a detailed panel with context, steps/turns, input tokens, output tokens, and total tokens.