Max-Samson/dsh-usage-chart ↗★ 9
dsh-usage-chart
DeepSeek 用量 / 成本 / 余额仪表盘 for DSH Web:输入框下方实时指标指示器 + 零依赖 SVG 用量可视化图表(含每轮成本视角、耗时叠加、异常标记、成本徽章、上下文压力条),token 数据来自官方 adapter 上报,成本按官方刊例价 + 用户覆盖 pricing.json 解析,余额来自官方 /user/balance 接口。 适合需要实时监控DeepSeek Token消耗、单轮成本及账户余额的用户。
설치
npx -p @deepseek-ai/dsh dsh plugin --profile web add github:Max-Samson/dsh-usage-chartdsh-usage-chart
A usage, cost, and account-balance dashboard for DeepSeek Harness Web.


简体中文 · Report an issue · Changelog (EN) · 更新日志(中文)
Interface preview: light English on the left and dark Simplified Chinese on the right. Both variants follow the DSH theme and in-app language setting.
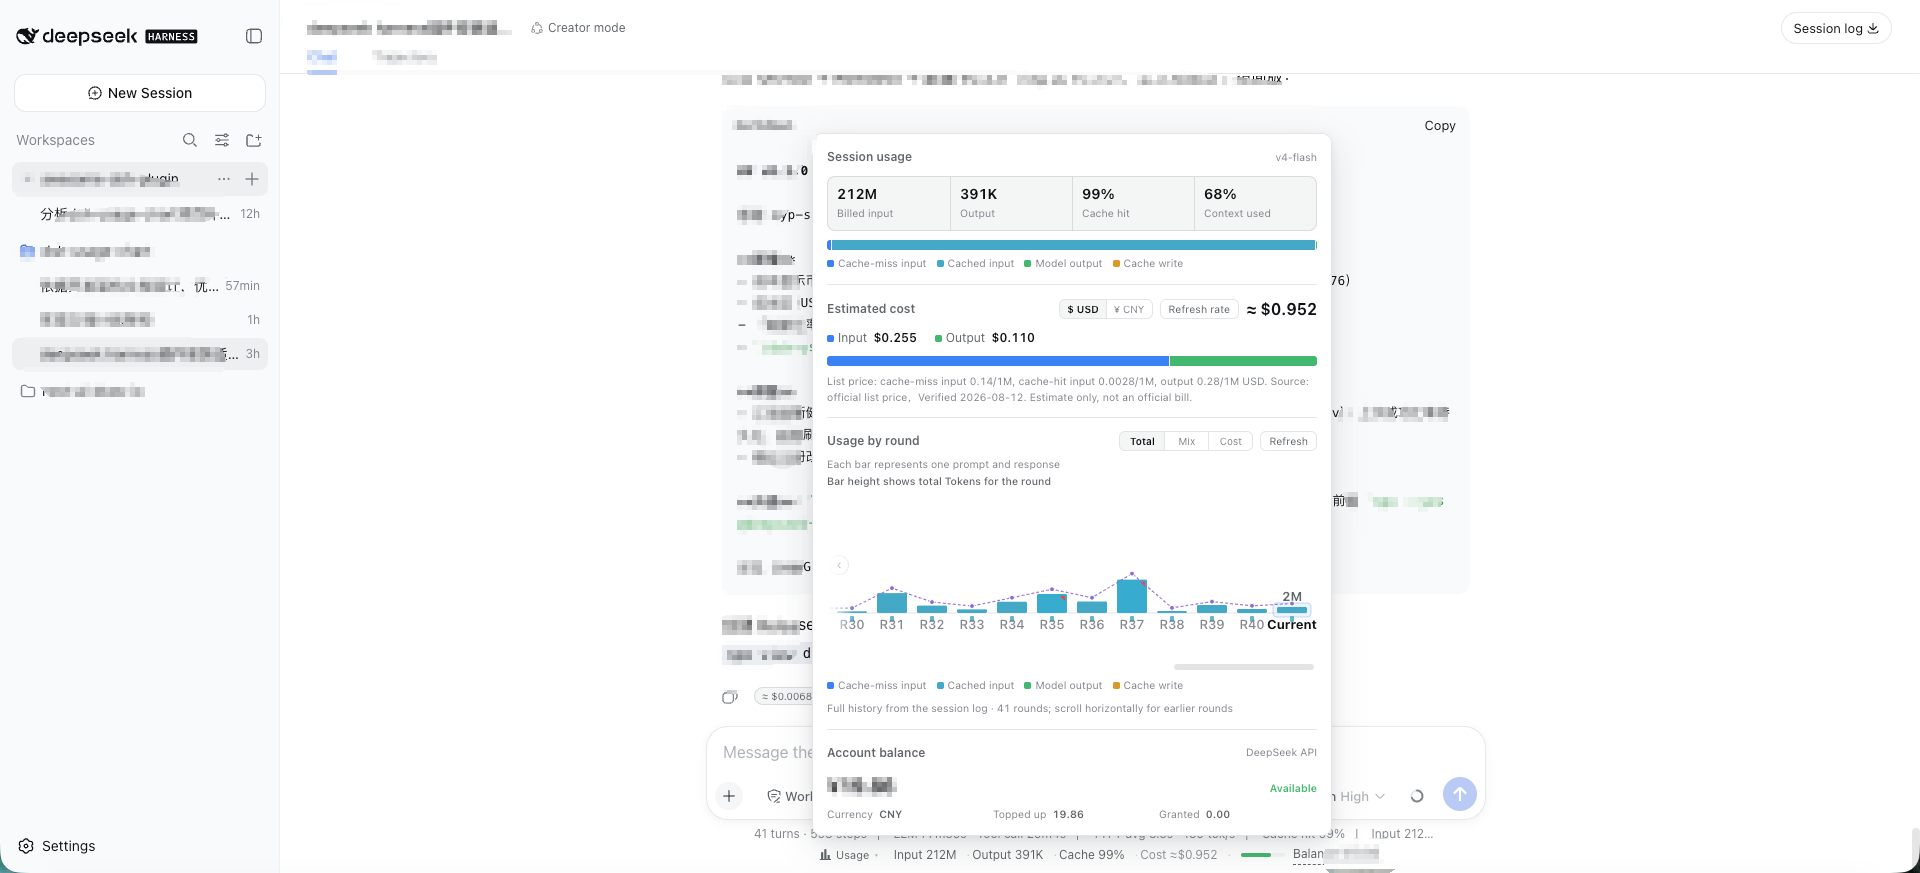
Light theme · English
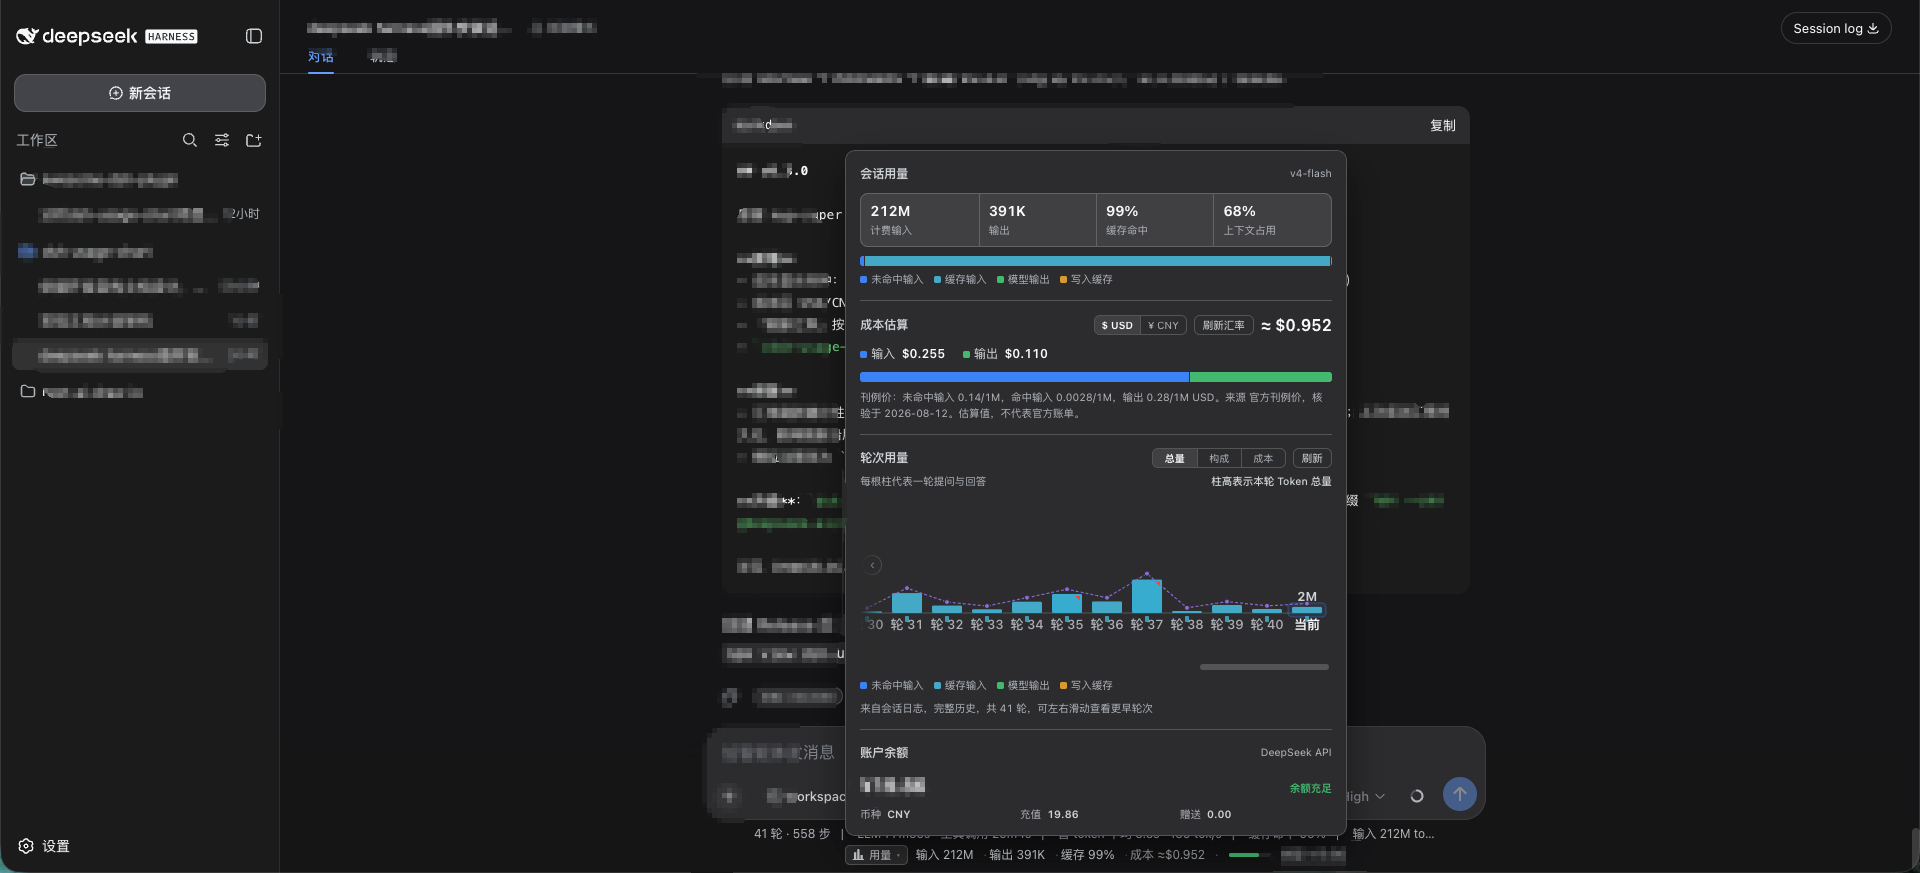
Dark theme · 简体中文
Both screenshots use fictional demo data only. They contain no real session content, token counts, costs, balances, or API keys.
The plugin adds a compact indicator below the conversation composer. It shows input/output tokens, cache-hit ratio, estimated cost, active model, a multi-segment context-pressure bar (system/tools/messages breakdown, v1.1.0), and DeepSeek account balance. Click it to open a zero-dependency SVG dashboard with per-turn usage history — including a cost view (every bar shows its own cost value, not just the current round), a duration overlay, anomaly markers, an explainer tooltip (tokens + cost + model + billing tier + duration/TTFT/TPS + user input source attribution: human/agent/continuation, v1.1.0 + end reason), horizontally scrollable per-round bars (all rounds, fixed slim bar width, auto-scroll to latest), a dedicated Context & Compaction Diagnostics section (system/tools/messages token composition, compaction timeline, freed tokens, summarize cost, context occupancy suggestions, v1.1.0), a dismissible ≈ ¥/$0.00xx badge on each assistant message, peak/off-peak tiered billing with a live red/green billing-tier tag in the panel (red = peak, green = off-peak, v1.0.1), and official dual-currency pricing (CNY from the Chinese pricing page, USD from the English pricing page — no FX conversion, v1.0.1).
▸ Input 12.4M · Output 86.2K · Hit 72% · Cost ≈$0.042 / ≈¥0.284 · demo-model · Balance --
Click ▸ to open the dashboard panel:
- Session usage summary — Input (uncached/cached), output, cache-hit percentage, and context occupancy (derived from official adapter
tokenUsage/contextPressureprojections). - Context breakdown & compaction diagnostics (v1.1.0) — Official
contextBreakdownprojection breakdown (System prompt / Tools schema / Message history token counts and percentage with a 3-segment color bar, annotated as heuristic approximations); Host foldscompaction/*events (which round was compacted, how many tokens were freed, model used, and summarize call cost); provides proactive suggestions (≥75% / ≥90% occupancy) to start a new session or reduce large file injections. - Cost estimation — Estimated from official list prices (CNY/USD dual-currency per 1M tokens, peak/off-peak tiers) with verified source date; supports user override via
pricing.json; unpriced models are explicitly tagged. - Session-cost aggregation (v1.1.7) — Adds the host's per-round costs using each round's model and billing tier. While a new round is in progress, the indicator and panel share the fetched history plus a marked estimate for new tokens, then refresh the history after token updates pause. The model label follows the same current-history/live-node priority in both places.
- DSH 0.1.2+ and themed docks (v1.1.7) — Reads conversation nodes from the independent
chatsource on newer DSH versions, with a legacy session-snapshot fallback; keeps the expanded panel anchored when a theme creates a fixed-position containing block. - Peak / off-peak tiered billing (v1.0.1) — Peak hours (Beijing time Monday–Friday 09:00–12:00 and 14:00–18:00, UTC 01:00–04:00 and 06:00–10:00) billed at 2× the off-peak rate; all other hours and weekends billed at off-peak rates; rounds bill automatically based on start time (or conservative peak if unknown); live red/green tag in the panel header.
- Official dual-currency list pricing (v1.0.1) — Builtin official CNY and USD prices directly used according to the active display currency — no FX conversion applied to costs (matching official billing); "Refresh rate" updates only the informational "1 USD ≈ X CNY" reference note.
- Multi-currency display (v0.3 / v1.0.1) — One-click toggle between USD and CNY (persisted in localStorage); indicator, panel, chart, and badges all follow.
- Per-round usage & source attribution (v1.1.0) — "Total / Composition / Cost" view modes; cost mode shows each bar's monetary amount; duration line overlay; anomaly marker chips on cost spikes; cache hit miniature ticks; hover explainer card with full round metrics + user input source attribution: human/agent/continuation; horizontal scroll for full session history.
- Cost badge — Dismissible
≈ ¥/$0.00xxbadge rendered at the bottom of each assistant message. - Multi-segment context pressure bar (v1.1.0) — Slim bar in the composer dock indicating total context occupancy from green to red, segmented by System (blue), Tools (amber), and Messages (green) with hover percentages.
- Account balance — Real-time balance queried via official DeepSeek API (proxied securely through Host, API key never exposed to browser).
- Bilingual (ZH / EN) — Automatically follows DSH in-app language setting, with runtime switching between
zhanden.
Data sources
| Metric | Source | Accuracy |
|---|---|---|
| Token usage | DSH official adapter session projections (tokenUsage / contextPressure) | ✅ Official real-time data |
| Cost | Official list price (builtin + optional pricing.json override, CNY/USD dual-currency / 1M tokens, peak/off-peak tiers) × reported usage | ⚠️ Estimate, not invoice; resolved via Host /pricing snapshot |
| Display currency | Host /meta config; costs directly calculated in selected currency list price | ✅ Official dual-currency list price |
| Per-round history | Host session log fold (/usage): duration / TTFT / TPS / model attribution / input source attribution / end reason / per-round cost | ✅ Official event stream fold |
| Context & compaction | Official contextBreakdown / contextPressure projections + Host compaction/* event fold | ✅ Official projections + event fold |
| Balance | Official GET https://api.deepseek.com/user/balance | ✅ Official real-time data |
| Model name | Adapter request provenance / request/context | ✅ Official real-time data |
Tech stack
- Language: TypeScript source, compiled to DSH loadable JavaScript bundles
- Framework: Cordis plugin model + React 18
- Build: esbuild (Host half = Node ESM; Client half = browser factory bundle matching DSH Web
PLATFORM_MODULES) - Visualization: Zero-dependency handcrafted SVG (matches platform rendering, minimal footprint, ultra-stable)
Install
Prerequisites: DeepSeek Harness ≥ 0.1.0-rc.6 · Node.js ≥ 20 · pnpm on PATH (dsh plugin forwards installs to pnpm).
If you get
dsh: command not found(or PowerShellThe term 'dsh' is not recognized…), you rannpx @deepseek-ai/dshtransiently — see FAQ item 1 (install globally, or prefix commands withnpx --yes @deepseek-ai/dsh).
Option 1: npm registry (recommended, prebuilt — no build tooling needed)
dsh plugin --profile web add dsh-usage-chart   # installs and registers the profile plugin layer
dsh web --profile web                          # starts DSH Web (stop it first if already running)
To update after 1.1.7 is published: pnpm may print Already up to date when already installed — use an explicit version (recommended) or remove then re-add:
### Balance query configuration

The balance query needs a DeepSeek API key, resolved per request in this order (no restart needed):

1. **DSH Web settings (recommended, requires plugin ≥ 0.1.1)**: configure the DeepSeek API key under Settings → Models. The plugin reads the same key through the DSH credentials service (`.credentials.yaml` user layer); no extra setup is required.
2. **Environment variable**: `DEEPSEEK_API_KEY=sk-...` before starting `dsh web` (the credentials service's `env` layer resolves it the same way).
3. **Plugin config**: override `config.apiKey` in the profile's `cordis.patch.yml` (stored in plain text on disk — only recommended for a protected local profile):

```yaml
- insert:
    - id: dsh-usage-chart
      name: dsh-usage-chart
      config:
        apiKey: 'sk-...'        # empty falls back to web settings / env variable
        baseUrl: 'https://api.deepseek.com'
        # pricingFile: '/path/to/pricing.json'   # optional: price override file
        # currency: 'cny'        # optional (v0.3): 'usd' (default) | 'cny'
        # cnyPerUsd: 6.76        # optional (v0.3): FX rate for note display
        # fxUrl: 'https://open.er-api.com/v6/latest/USD'   # optional (v0.3): custom live rate source
The key stays in the Host process and is never sent to the browser.