AlfredChaos/dsh-usage-stats ↗★ 0
dsh-usage-stats
DeepSeek Harness 消耗统计插件:在设置页展示 Token 用量 KPI、半年活跃贡献热力图、按模型堆叠柱状图与模型环形图。
AI 分析
核心用途是通过扫描历史会话日志,提供直观的 Token 消耗和活跃度可视化图表。适合需要复盘、分析大模型使用频次和成本分布的用户。
安装
$
npx -p @deepseek-ai/dsh dsh plugin --profile web add github:AlfredChaos/dsh-usage-stats说明文档
阅读完整 README ↗dsh-usage-stats
Token usage statistics for DeepSeek Harness, shown as a page under Settings → Usage in the web GUI. The plugin rescans persisted session logs and never writes anything back.
简体中文 · 


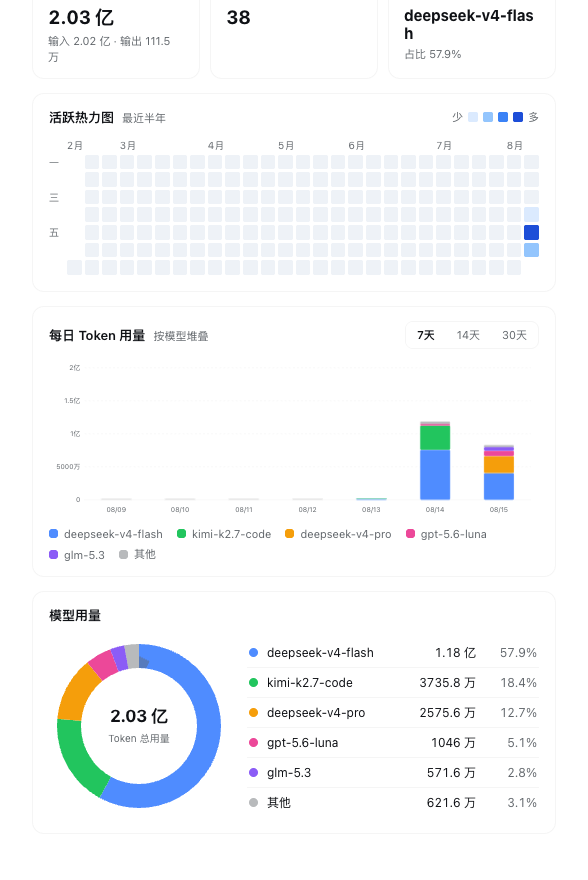
What it shows
- Cumulative totals (all time) — input and output tokens, session count, and the most-used model with its share.
- Activity heatmap — the last six months in a GitHub-contribution layout (weeks as columns, weekdays as rows). Days are colored by quartile over non-zero usage.
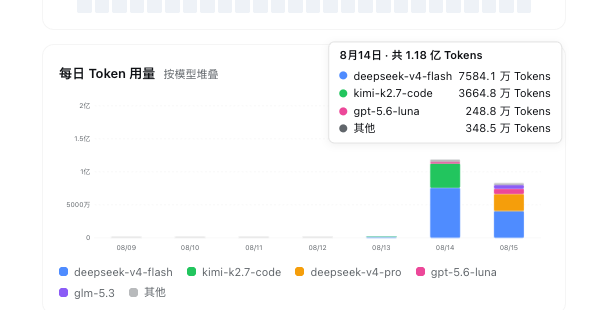
- Daily stacked bars — per-model token usage, switchable between the last 7, 14, or 30 days.
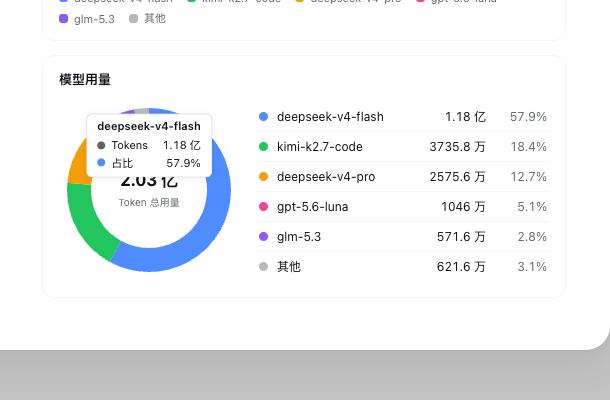
- Model donut — all-time share per model, with the top 5 listed beside it and the rest folded into "other".
Hovering a bar or a donut segment shows the exact breakdown:
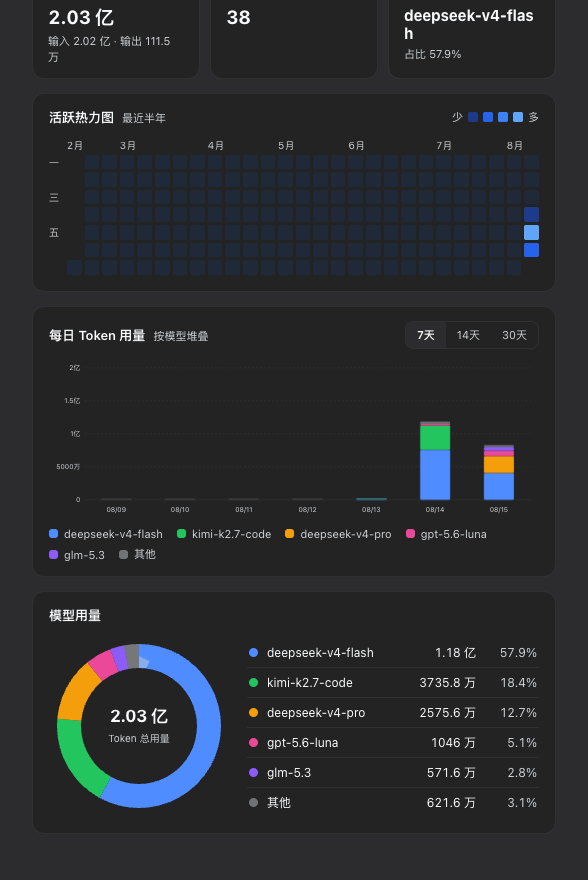
| Bar tooltip | Donut tooltip | Dark theme |
|---|---|---|
|
|
|
Install
The plugin ships as a bundle: dsh plugin add appends it to the profile's bundle list, and the patch row activates the host half.