feiyang-dev/dsh-usage-plugin ↗★ 36
@feiyang666/dsh-usage-plugin
记录Token用量与费用,支持分时计费与导出 适合需要精确统计每次调用成本、查看消费热力图并导出CSV/JSON报表的用户。
安装
npx -p @deepseek-ai/dsh dsh plugin --profile web add github:feiyang-dev/dsh-usage-plugin说明文档
阅读完整 README ↗DeepSeek Harness Usage & Cost Tracker (dsh-usage-plugin)
English · 简体中文
A community plugin for DeepSeek Harness — records token usage and cost for every model call, with peak/off-peak billing, balance query, a calendar heatmap, and CSV / JSON / PNG export.



🔔 Important Notice (2026-08-16): npm package renamed
The npm package has been renamed from
@feiyang666/deepseekharnessdesktopto@feiyang666/dsh-usage-plugin(matching the GitHub repofeiyang-dev/dsh-usage-plugin).
- Use the new package name for install / upgrade:
dsh plugin --profile web add @feiyang666/dsh-usage-plugin- The old package
@feiyang666/deepseekharnessdesktopremains published for a while, but it is no longer maintained and will not receive updates — please migrate soon.- The desktop client (
DeepSeek Harness Desktop) supports both package names and will auto-detect old-name installs with a one-click update to the new name.
Overview
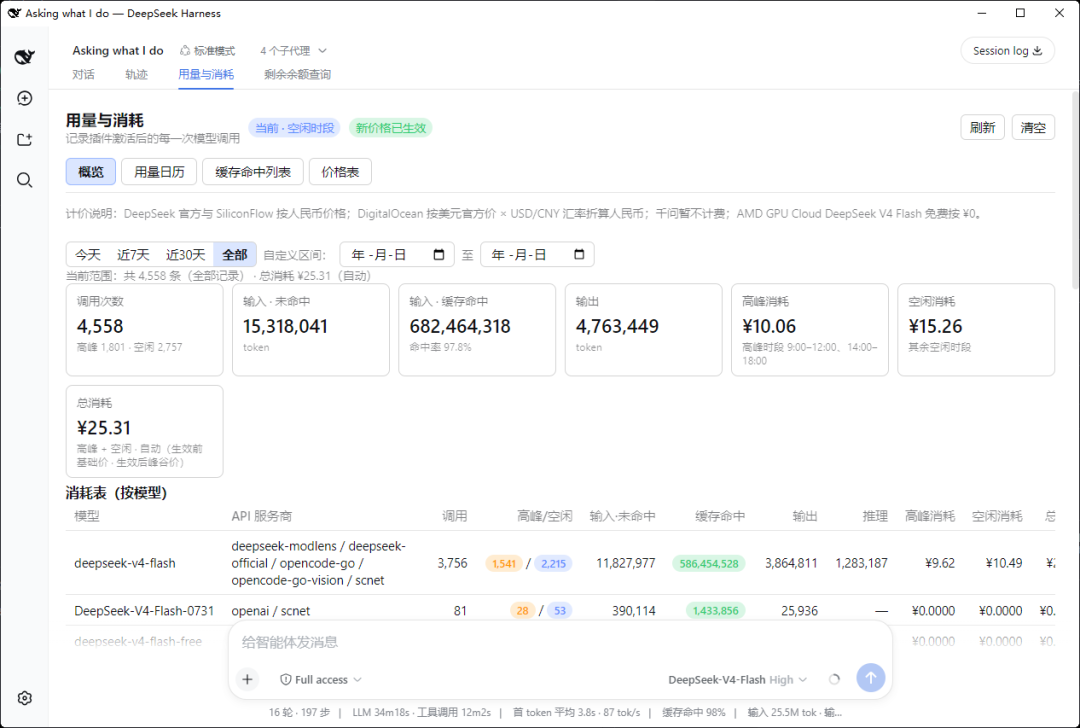
dsh-usage-plugin is a usage & cost tracker plugin in the DeepSeek Harness ecosystem (a DSH plugin shipped as a Host + Client two-in-one package). After installation, "Usage & Cost" and "Balance Query" tabs appear in the Web UI, right after "Conversation" and "Trace":
Supports Windows / macOS / Linux: paths are handled per platform (
node:path), and the folder picker / "reveal in file manager" use each OS's native mechanism (macOS:osascript/open; Linux:zenity/xdg-open). Balance query and export do not depend on Windows-only commands.
- Usage & Cost: records each model call's token usage and cache hits (input miss / cache hit / cache write / output / reasoning / finish reason), and computes cost using DeepSeek's peak/valley or base pricing (peak hours on weekdays are automatically priced by Beijing time 09:00–12:00 and 14:00–18:00; since 2026-08-23 weekends are billed entirely at the off-peak rate; since 2026-09-10 12:00 Beijing time the post-V4.1-Flash peak/valley prices apply —
deepseek-flashoff-peak cache hit 0.02 / input 1 / output 4 CNY, peak at twice that). Model names come from the actual request parameters, so non-DeepSeek models are shown truthfully instead of "unknown model"; models without an official price are counted as 0. The overview shows a by-model table plus a by-API-provider × model drill-down (each provider grouped with every model's calls and peak/off-peak cost split) and a grand total row. The overview also supports date filtering (Today / Last 7 days / Last 30 days / All, plus a custom start–end range), so the aggregate stats can be scoped to any single day or date range. - Usage Calendar: a monthly daily-usage heatmap (colored by cost or call count), hover for details including the peak/off-peak cost split, click a day for its call list and peak/off-peak totals, plus a per-day statistics table with peak cost / off-peak cost / total columns and rollups. Supports date-range filtering (Today / 7 days / 30 days / All plus custom start–end dates): when a range is active, the daily stats table shows every day in range across months, the top cards switch to "Calls in range / Cost in range" with range totals, and the heatmap only colors days inside the range.
- Cache Hit List: newest-first, fully scrollable, with quick filters (Today / 7 days / 30 days / All) and custom date ranges; the summary line and footer total split peak vs off-peak consumption with a grand cost total. The list is paginated (100 rows per page), so it stays smooth even with large data volumes.
- Interrupted calls shown truthfully: calls that were aborted / errored / timed out (e.g. manually stopped generation, stream interruption) are shown with a red "Interrupted" badge, the finish reason (Interrupted / Error / Timeout) and a
—cost. The official console still counts these as API requests and bills their actual tokens, but the harness does not report their usage to the plugin — so the plugin records them at 0 tokens, keeping the call count aligned with the official console while costs are unaffected. The Overview's "Calls" card adds a· interrupted N (not billed)hint. - Local stats vs official console: a fixed notice banner at the top of the panel explains that this panel reflects calls captured locally by the plugin (official prices + peak/off-peak hours), and that the official console (platform.deepseek.com usage page) may show a higher amount because: ① interrupted/failed/timed-out calls are still billed by the console while the plugin records them as 0; ② calls from other API keys on your account (other apps/scripts) do not pass through DeepSeek Harness — the console includes them, the plugin does not; ③ for exact reconciliation, export the official monthly billing CSV and compare. When interrupted calls are detected, the banner also shows a red "Current records include N interrupted call(s) (not billed)" line.
- Price Table: the official DeepSeek API price table (covering
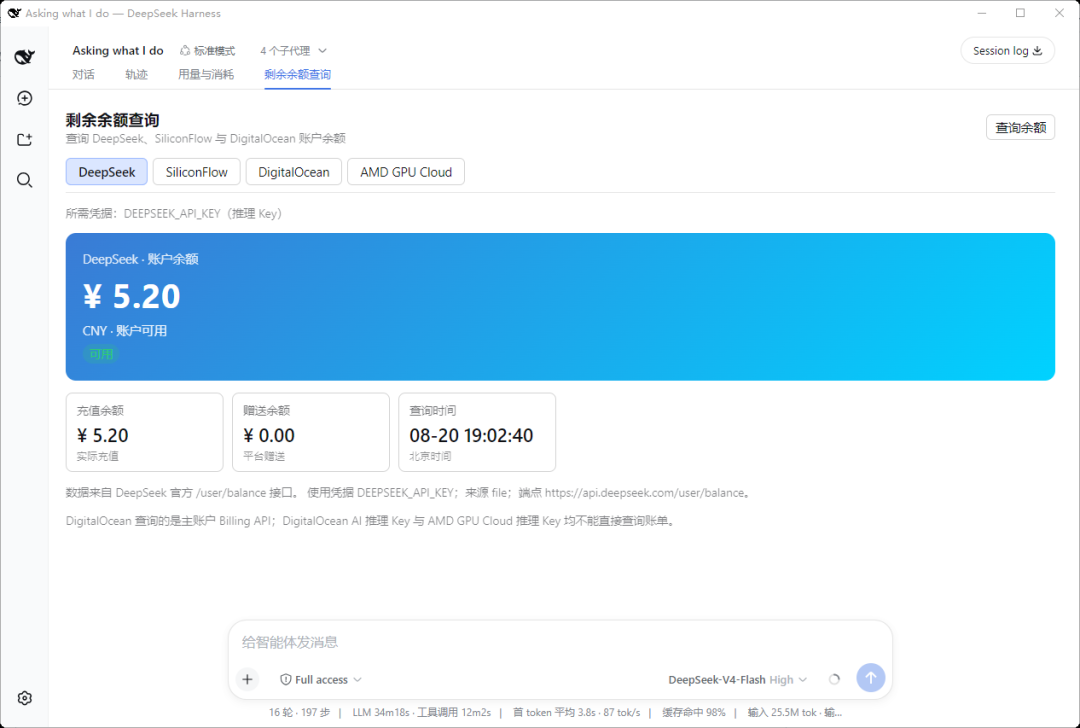
deepseek-flash= DeepSeek-V4.1-Flash anddeepseek-v4-pro; the legacy idsdeepseek-v4-flash/deepseek-v4-flash-vision-expstay callable and fold into the Flash tier) — base and peak/valley unit prices shown side by side (peak vs off-peak). The peak/off-peak tables are date-split: the first version applies from 2026-08-17, and the post-V4.1-Flash version applies from 2026-09-10 12:00 Beijing time (deepseek-flashoff-peak lowered to cache hit 0.02 / input 1 / output 4 CNY, peak at twice that;deepseek-v4-prounchanged) — past calls are always billed with the version in force at their own time. Editable in-panel and persisted topricing.json, with a reset-to-default option. - Balance Query: queries your DeepSeek account balance using the configured
DEEPSEEK_API_KEY. - Export: CSV / JSON / PNG long image (newest-first, up to the latest 2000 records, warns if exceeded; the PNG report includes peak/off-peak cost columns), to any directory (native picker), auto-opens the folder after export.
- Import: merge-imports JSON / CSV files, deduplicated by time.
- Persistence: records are written live to
/dsh-usage/usage-records.jsonand restored on restart (cap 100000 records). - UI adaptation: panel typography scales with the app's display-size setting (em-relative fonts); wide tables scroll horizontally on desktop (
max-content+overflow-x) and fit the screen width on mobile (≤900px, no horizontal scrollbar); popup cards adapt to the viewport. - English UI (i18n): the panel follows the harness's own language setting (General Settings → Language) — switch it there and the plugin follows instantly, no separate toggle, no
localStorageoverride. The bilingual dictionary covers the whole panel, the peak/off-peak billing-period hints, the balance query and the PNG report; host-level Conversation/Settings tab labels are re-read per render, so they follow the language switch live. - Per-message token popup: when a turn finishes, the assistant message's footer action row shows a "Turn tokens" button; clicking opens a
Token Detailspopup in two layers — Conversation total (the whole session's total tokens / total cost / run time / cache-hit rate) and This turn (this output's tokens, turn tokens, turn cost, turn duration, turn cache-hit rate, a cache-hit bar, and per-model cards showing each model's input·miss / cache hit / output (+ reasoning) plus its peak/off-peak cost split). Durations are shown asXm Ys. Each usage record is tagged with the conversation (sessionId), so per-turn and per-conversation stats are computed independently. - Internal/tool calls grouped separately: internal/placeholder calls (e.g.
dsh2shell-*with modelfake) are excluded from the model cost breakdown and collected in a collapsible "Tool calls (internal)" group below the breakdown, so only real model calls count in the cost tables. - Mobile adaptation: tables fit the screen width on ≤900px (no horizontal scrollbar); wide tables collapse the middle columns; the popup and its stat cards / per-model cards adapt to the viewport.
Screenshots
Usage & Consumption
Balance Query
Recommended Installation
Either method works and is equivalent. We recommend the desktop app — fully graphical, no command line needed.
Option 1 (recommended): One-click via the desktop app
Install DeepSeek Harness Desktop, open it, then go to "Install Plugins" → Recommended → Usage & Cost Tracker → Install and click "Restart Service Now" to activate.
Option 2: Command line
### Usage & Consumption

### 5. Configuration (for balance query)
"Balance Query" uses the configured `DEEPSEEK_API_KEY`: set the API Key in **Settings → Models** (same key used for chats), then open the "Balance Query" tab and click "Query Balance".
---